


10 Best Metaverse Crypto Projects To Watch Out For in 2023
Everyone has very little or no knowledge about the Metaverse. What does it mean and how does it work? We might not...

Build AI-powered dashboards that bring together business data, interactive visualizations and intelligent analysis to help teams understand what is happening, why it matters and where attention is needed.
Web30 India develops AI dashboards with live data integration, automated insights, natural-language queries, predictive analytics, anomaly detection and role-specific decision views.
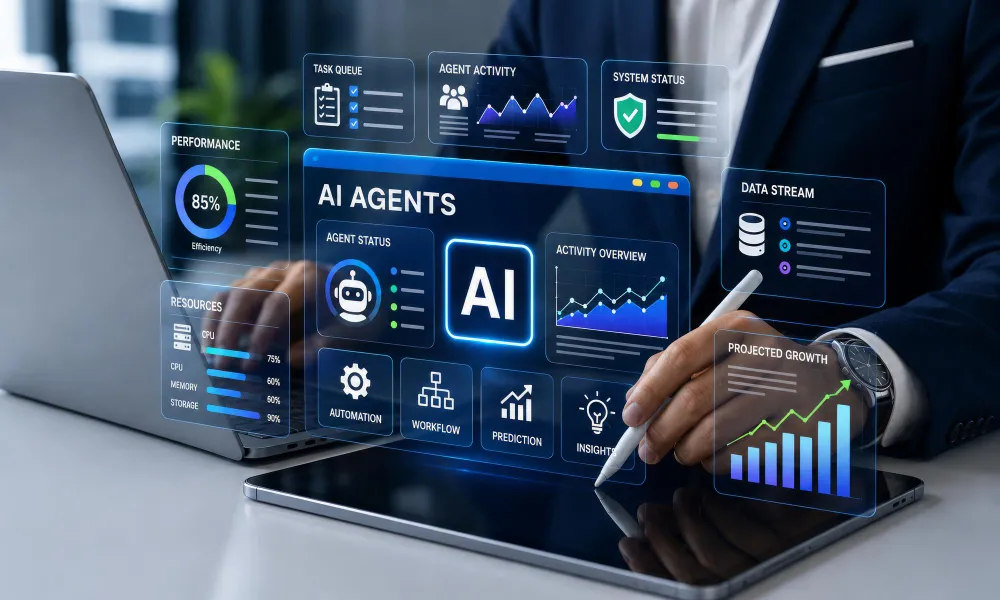












A traditional dashboard shows what the numbers look like. An AI dashboard can go further by helping users explore the data, identify unusual patterns, understand changes and ask questions in natural language.
Instead of requiring every user to manually inspect charts and filters, AI can help surface relevant trends, summarize performance and support deeper analysis. Current Power BI Copilot capabilities include natural-language questions, generated visuals and report summaries grounded in report data.
Web30 India builds AI dashboards around the complete data journey, from source systems and data pipelines to semantic models, visualizations, AI analysis and decision workflows.
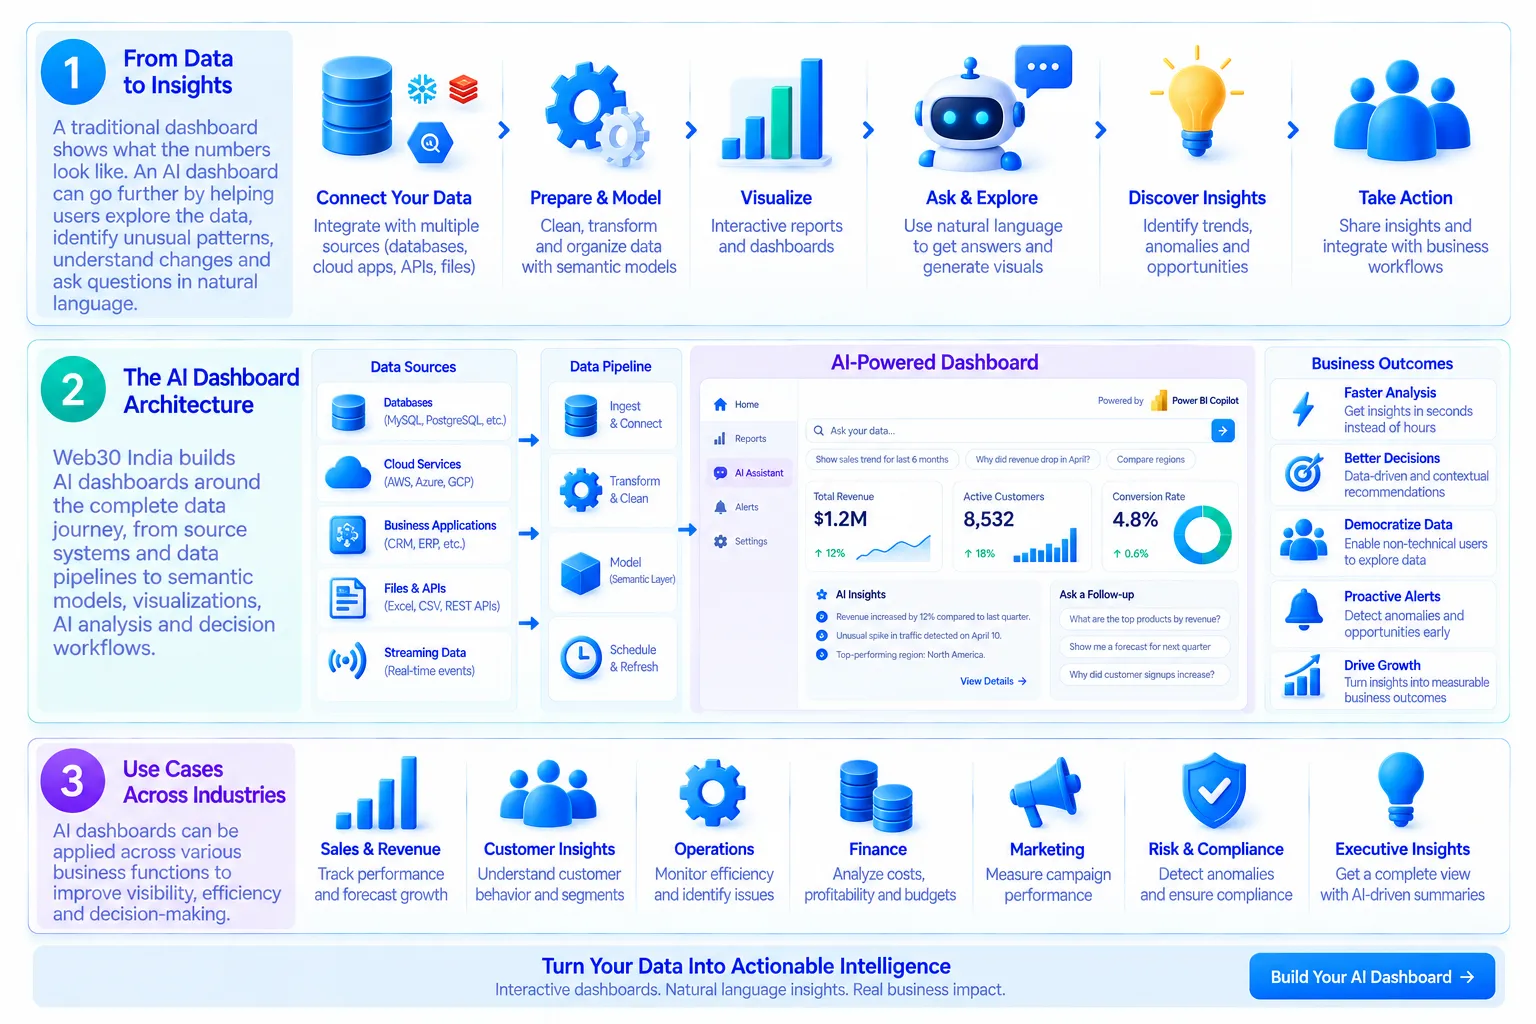
Bring revenue, operations, finance, customer and business performance indicators into a single decision-oriented view.
Track pipeline, conversion, revenue, sales performance, customer segments and regional trends with AI-assisted analysis.
Monitor financial performance, budgets, expenses, cash flow, profitability and important changes across business units.
Connect operational data to monitor processes, productivity, service levels, resource utilization and exceptions.
Combine customer, product and engagement data to understand behavior, retention, satisfaction and customer value.
Add natural-language analysis, automated insights, forecasting, anomaly detection and other AI capabilities to existing BI environments.
AI dashboards often bring together sensitive financial, customer, operational and organizational data. Access controls and data governance therefore need to be considered alongside visualization and AI capabilities. Modern Power BI AI experiences, for example, enforce existing row-level and object-level security when generating AI-assisted answers and summaries.
Control who can access dashboards, reports, data sources and AI-powered analytical capabilities.
Apply appropriate row-level, column-level or object-level access controls based on users and business roles.
Protect sensitive business, customer, financial and operational information throughout the analytics pipeline.
Define which data and analytical capabilities AI features can access and use.
Secure dashboard applications, APIs, data connections and supporting infrastructure.

Track dashboard access, data activity, AI interactions, refresh events and relevant administrative actions.
Validate incoming data and analytical models before information reaches decision dashboards.
Provide context, source references or supporting visualizations where AI-generated insights require verification.
Keep important business decisions with authorized users rather than treating AI-generated recommendations as automatic decisions.
Connect business systems, databases, APIs and other approved sources.
Clean, transform and structure information for analytics and reporting.
Create business metrics, relationships, dimensions and analytical models required by the dashboard.
Present KPIs, trends, comparisons and operational information through interactive dashboards.
Analyze the available data to identify trends, anomalies, changes, forecasts or answers to natural-language questions.
Users investigate the underlying information, identify the required response and connect insights with business workflows where appropriate.

Connect financial, accounting, procurement and operational data for unified business reporting.
Bring together leads, opportunities, customers, revenue and sales activity.
Connect orders, products, customers, inventory, payments and fulfillment data.
Integrate structured business data from PostgreSQL, MySQL, SQL Server, Snowflake, BigQuery and other platforms.
Connect cloud storage, data lakes, analytics platforms and managed data services.
Bring in information from third-party services, partner systems, market data and custom applications.
Provide leadership with consolidated business performance, trends, exceptions and key indicators.
Monitor pipeline, conversion, revenue, territory performance and sales forecasting.
Track profitability, expenses, budgets, cash flow and financial performance.
Understand customer acquisition, engagement, retention, segmentation and lifetime value.
Monitor productivity, service levels, resource utilization, exceptions and operational trends.
Track inventory, procurement, shipments, suppliers, demand and logistics performance.
Monitor production, quality, equipment performance, downtime and operational efficiency.
Connect campaign, customer, acquisition and conversion data to understand marketing performance.



Identify the decisions, business questions, users and performance indicators the dashboard needs to support.
Map existing databases, applications, APIs, reports and data platforms that will contribute to the dashboard.
Define data flows, transformation requirements, analytical models, KPIs and AI capabilities.
Design role-specific views, information hierarchy, visualizations, filters and interaction patterns.
Implement natural-language analysis, automated summaries, anomaly detection, forecasting or other AI capabilities relevant to the use case.
Connect source systems and validate data accuracy, dashboard behavior, AI outputs, permissions and performance.
Deploy the dashboard environment and establish access, refresh schedules, monitoring and user workflows.
Review usage, business feedback, data quality and analytical performance to improve the dashboard over time.
Explore practical insights on AI dashboards, business intelligence, data visualization, predictive analytics, natural-language analytics, executive dashboards, data engineering, AI-powered reporting and enterprise analytics.
Everyone has very little or no knowledge about the Metaverse. What does it mean and how does it work? We might not...
Today, smart contracts are beneficial for companies. This in-depth guide goes into great detail about their unique...
Everyone must be aware of how important it is to have a website in order to make a mark in the IT business industry...
Welcome to the next gaming frontier, where virtual worlds collide with reality to create immersive experiences like...
DeFi is an innovative system that will fundamentally change global finance. In summary, DeFi is an open monetary sy...
Everyone has very little or no knowledge about the Metaverse. What does it mean and how does it work? We might not...
Today, smart contracts are beneficial for companies. This in-depth guide goes into great detail about their unique...
Everyone must be aware of how important it is to have a website in order to make a mark in the IT business industry...
Welcome to the next gaming frontier, where virtual worlds collide with reality to create immersive experiences like...
DeFi is an innovative system that will fundamentally change global finance. In summary, DeFi is an open monetary sy...
Everything you need to know about our enterprise blockchain engineering process, costs, security, and architectures.
Where connections are brewed, ideas percolate, and inspiration flows!
Let’s hear about your project. Drop us the details or send us a direct email
 24/7 Support